How to Know If Your Ads Are Actually Working

You’re spending money on ads. Traffic is coming in. But are those ads actually working—or just burning budget while people who would have bought anyway click through?
This is one of the hardest questions in marketing. And honestly, there’s no perfect answer. But there are practical ways to get close enough to make smart decisions about your ad spend.
This guide covers the metrics that matter, the formulas you need, and a realistic framework for evaluating whether your advertising is paying off.
Why Measuring Ad Effectiveness Is Hard
Before diving into metrics, let’s acknowledge the challenges:
Attribution is messy. Someone sees your ad, doesn’t click, then searches your brand name a week later and buys. Did the ad work? Technically yes, but your analytics might credit organic search. We covered this complexity in our guide to attribution.
Correlation isn’t causation. Sales went up after you launched ads. But was it the ads, or seasonality, or a competitor going out of business? Hard to know for sure.
Different goals need different metrics. Brand awareness campaigns shouldn’t be judged by the same standards as direct response ads.
The thing most guides don’t tell you: perfect measurement is impossible. The goal is to be less wrong over time and make better decisions than you would with no data at all.
The Three Core Metrics: ROI, ROMI, and ROAS
These three metrics measure profitability, but in slightly different ways. Understanding when to use each one matters.
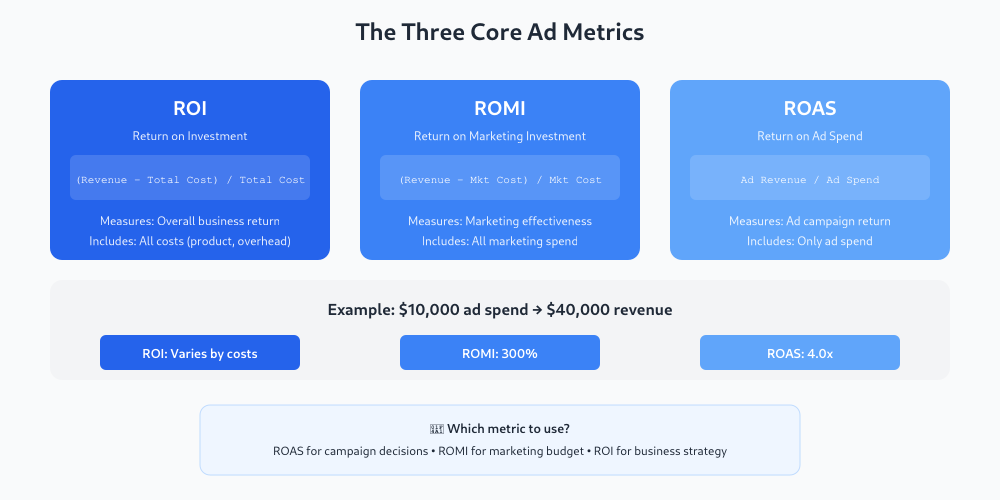
ROI (Return on Investment)
The classic business metric. Measures overall return relative to what you spent.
Formula: (Revenue - Total Cost) / Total Cost × 100
Example: You spend $10,000 on ads. Those ads generate $25,000 in revenue, but your product costs $12,000 to fulfill. ROI = ($25,000 – $10,000 – $12,000) / $10,000 = 30%
When to use: When you want the full picture including product costs, overhead, and all expenses—not just ad spend.
ROMI (Return on Marketing Investment)
Similar to ROI, but focused specifically on marketing activities.
Formula: (Revenue from Marketing - Marketing Cost) / Marketing Cost × 100
Example: Your marketing campaign costs $5,000 and generates $20,000 in attributable revenue. ROMI = ($20,000 – $5,000) / $5,000 = 300%
When to use: When evaluating overall marketing effectiveness across multiple channels and campaigns. ROMI above 100% means your marketing is profitable.
ROAS (Return on Ad Spend)
The most common metric for paid advertising. Measures revenue generated per dollar spent on ads.
Formula: Revenue from Ads / Ad Spend
Example: You spend $2,000 on Google Ads and generate $8,000 in tracked revenue. ROAS = $8,000 / $2,000 = 4.0 (or 400%)
When to use: For evaluating specific ad campaigns or platforms. A ROAS of 4.0 means you get $4 back for every $1 spent.
In my experience working with clients, ROAS is the metric most teams default to—but it can be misleading if you don’t account for product margins. A ROAS of 3.0 sounds great until you realize your margins are only 20%.
What’s a “Good” ROAS?
The honest answer: it depends entirely on your margins and business model.
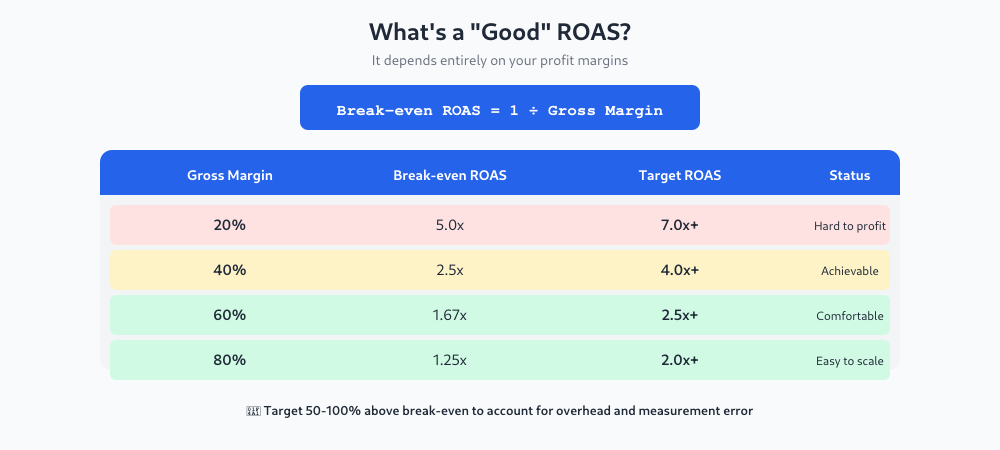
Break-even ROAS = 1 / Gross Margin
If your gross margin is 40%, you need a ROAS of at least 2.5 just to break even on ad spend. Anything above that is profit (before accounting for other costs).
What I’ve seen work best: know your break-even ROAS, then set targets 50-100% above it to account for overhead, returns, and measurement error.
Beyond ROAS: Other Metrics That Matter
ROAS tells you about immediate return, but it doesn’t capture everything. These additional metrics round out the picture:
CPA (Cost Per Acquisition)
How much you spend to acquire one customer.
Formula: Total Ad Spend / Number of Conversions
Lower is better, but context matters. A $200 CPA is terrible for a $50 product but excellent for a $2,000 service.
CAC (Customer Acquisition Cost)
Similar to CPA, but includes all marketing and sales costs—not just ads.
Formula: Total Marketing + Sales Cost / New Customers Acquired
LTV:CAC Ratio
Compares customer lifetime value to acquisition cost. This is especially important for subscription businesses or those with repeat purchases.
Formula: Customer Lifetime Value / Customer Acquisition Cost
A ratio of 3:1 or higher is generally considered healthy. Below 1:1 means you’re losing money on every customer—even if individual campaigns look profitable.
Conversion Rate
What percentage of ad clicks turn into conversions?
If you’re tracking campaigns with UTM parameters, you can measure this per campaign, per ad, per audience segment.
Low conversion rate + high traffic = problem with your landing page or offer, not necessarily your ads.
A Practical Framework: Is This Ad Working?
Here’s the decision process I walk clients through:
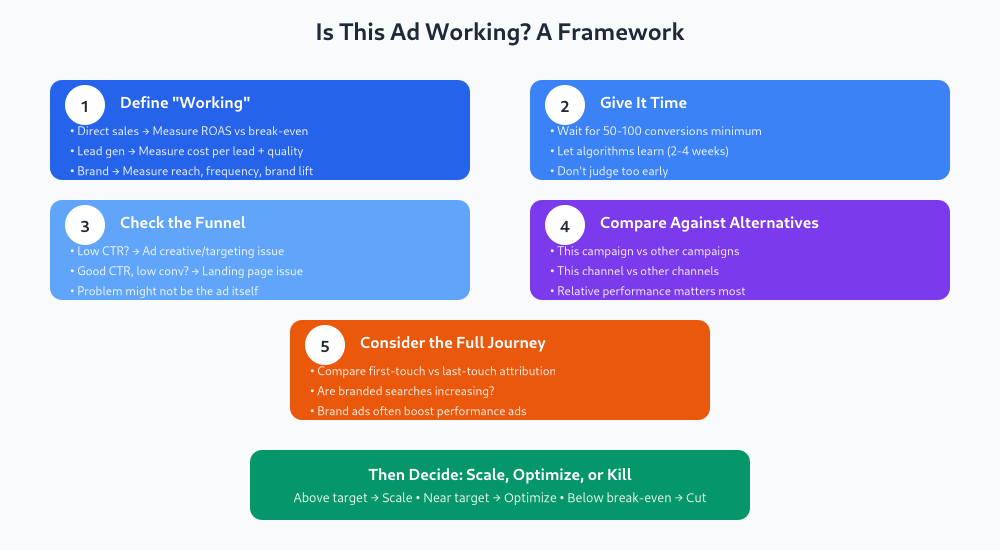
Step 1: Define “Working”
Before looking at data, decide what success means for this campaign:
- Direct sales? Measure ROAS against your break-even target.
- Lead generation? Measure cost per lead and lead quality.
- Brand awareness? Measure reach, frequency, and brand lift (if you can measure it).
Be specific. “More sales” isn’t a goal. “ROAS above 3.5” or “CPA below $50” is a goal.
Step 2: Give It Time
New campaigns need data to optimize. Platform algorithms need time to learn. Judging a campaign after two days usually leads to bad decisions.
Rule of thumb: wait until you have at least 50-100 conversions before making big changes. For smaller budgets, that might mean 2-4 weeks of data.
Step 3: Check the Funnel
Poor ad performance isn’t always the ad’s fault. Before blaming the ad, check:
- Click-through rate (CTR) — If low, the ad creative or targeting needs work.
- Conversion rate — If CTR is fine but conversions are low, the problem is your landing page or offer.
- Funnel drop-off — Use funnel analysis to find where people abandon.
Step 4: Compare Against Alternatives
A ROAS of 2.5 might be “bad” for one channel but “great” for another. Compare:
- This campaign vs. your other campaigns
- This channel vs. other channels
- This month vs. last month
- Paid vs. organic (what’s your organic conversion rate?)
Relative performance matters as much as absolute numbers.
Step 5: Consider the Full Journey
Last-click attribution often undercredits awareness campaigns. If you’re running both brand and performance ads, look at:
- Do performance campaigns do better when brand campaigns are running?
- What does first-touch attribution show vs. last-touch?
- Are branded search conversions increasing? (Often a sign that brand ads are working)
We covered this in depth in our attribution guide.
The Incrementality Question
Here’s the uncomfortable truth: some of your ad-attributed conversions would have happened anyway.
Someone searches your brand name, clicks your branded search ad, and buys. The ad gets credit—but they were already looking for you. Would they have bought without the ad? Probably.
Incrementality testing tries to answer this by running controlled experiments:
- Show ads to one group (test)
- Don’t show ads to another similar group (control)
- Compare conversion rates between groups
The difference is your true incremental lift—the sales that only happened because of the ad.
Most small and mid-sized businesses don’t run incrementality tests (they require statistical sophistication and significant budget). But it’s worth knowing that your reported ROAS is probably overstated to some degree.
A practical compromise: be conservative with your targets. If you need a ROAS of 3.0 to be profitable, target 4.0+ to account for the incrementality gap.
When to Kill a Campaign
Not every campaign works, and that’s okay. Here’s when to pull the plug:
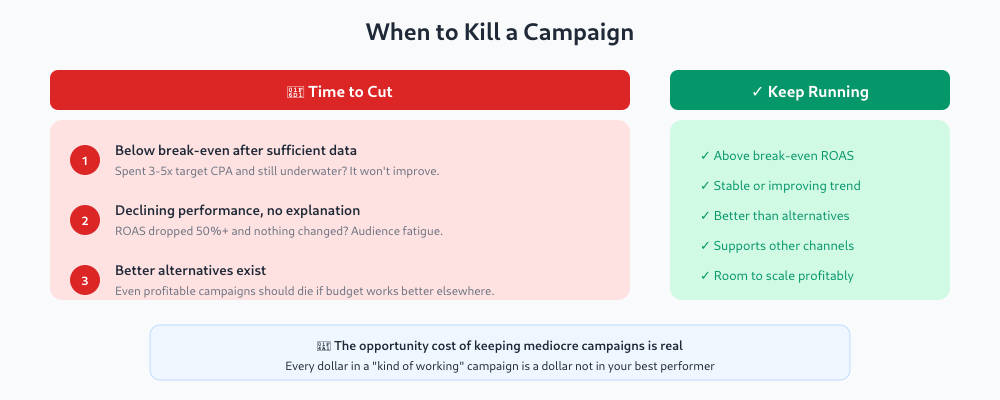
- Below break-even after sufficient data — If you’ve spent 3-5x your target CPA and you’re still underwater, it’s not going to magically improve.
- Declining performance with no explanation — If ROAS dropped 50% and you haven’t changed anything, the audience may be fatigued.
- Better alternatives exist — Even a profitable campaign should be cut if that budget performs better elsewhere.
I’ve made this mistake myself: keeping mediocre campaigns running because they were “kind of working.” The opportunity cost of not reallocating that budget to better performers is real.
Getting Started
If you’re feeling overwhelmed, start here:
- Know your margins. Calculate your break-even ROAS. Everything else depends on this number.
- Track conversions properly. Make sure you’re measuring the right conversions with proper attribution.
- Focus on ROAS first. It’s not perfect, but it’s the most actionable metric for most advertisers.
- Give campaigns time. Don’t judge too early. Wait for statistical significance.
- Compare, don’t just measure. Absolute numbers matter less than relative performance.
Perfect ad measurement doesn’t exist. But with the right metrics and a clear framework, you can make decisions that are much better than guessing—and that’s ultimately what “knowing if your ads work” means.
Keep reading: the dashboard pyramid: 3 layers every analytics stack needs.
Jonathan Harrington
I write practical, no-preamble guides on web analytics, privacy-friendly tracking and data-driven marketing — start with the problem, then pick the data.
More about me →