Finding Funnel Leaks: A Step-by-Step Approach

Your funnel looks fine on paper. Visitors arrive, some add to cart, a few check out. But somewhere between “interested” and “converted,” you’re losing people—and you’re not sure where or why.
That’s a funnel leak. And until you find it, you’re leaving conversions on the table.
This guide walks you through a practical process for identifying where your funnel breaks down and what to do about it. No expensive tools required—just your analytics and a systematic approach.
What Is a Funnel Leak?
A funnel leak is any point in your conversion path where potential customers drop out before completing the desired action. Every funnel has drop-off—that’s normal. The problem is when drop-off is higher than it should be at a specific step.
Think of it like a literal funnel with holes. Water (traffic) goes in the top, but some escapes through gaps before reaching the bottom (conversion). Your job is to find the biggest holes and patch them.
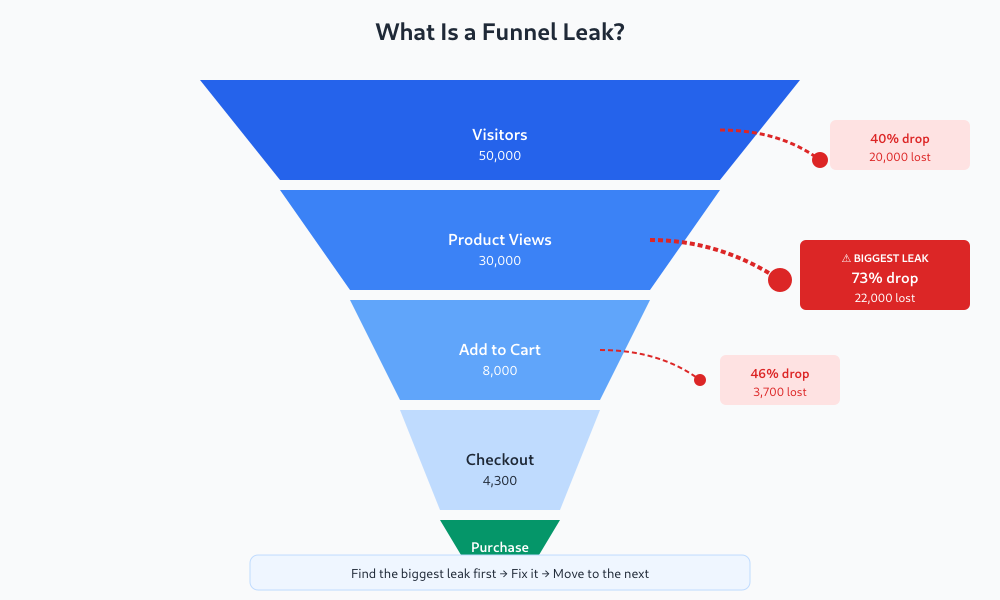
The key insight: not all drop-offs are equal. A 10% drop-off where 40,000 users pass through matters more than a 25% drop-off affecting only 2,000 users. You need to find leaks that are both significant and fixable.
Step 1: Map Your Funnel
Before you can find leaks, you need to know what your funnel actually looks like. Most sites have multiple funnels, and your landing pages are often the first step, but start with your primary conversion path.
For an e-commerce site, this might be:
- Landing page view
- Product page view
- Add to cart
- Begin checkout
- Purchase complete
For a SaaS product:
- Homepage visit
- Pricing page view
- Sign-up started
- Sign-up completed
- First key action (activation)
Write down each step. If you haven’t already defined which conversions matter most, do that first—otherwise you’ll be optimizing the wrong things.
Step 2: Get Your Baseline Numbers
For each step in your funnel, you need two numbers: volume (how many users reach this step) and conversion rate to the next step (what percentage continue).
Pull data for the last 90 days to get a stable baseline. Here’s what that might look like:
| Step | Users | Drop-off to Next Step |
|---|---|---|
| Product page view | 50,000 | — |
| Add to cart | 8,000 | 84% dropped |
| Begin checkout | 4,300 | 46% dropped |
| Purchase complete | 2,150 | 50% dropped |
In Google Analytics 4, use the Funnel Exploration report (Explore → Funnel exploration). In Plausible or Umami, you’ll need to track custom events for each step and calculate manually.
The thing most guides don’t tell you: don’t just look at percentages. That 84% drop-off from product view to add-to-cart represents 42,000 people. Even a small improvement there has massive impact.
Step 3: Identify Your Biggest Leak
Now find the step with the worst combination of high drop-off rate AND high volume. This is your biggest leak.
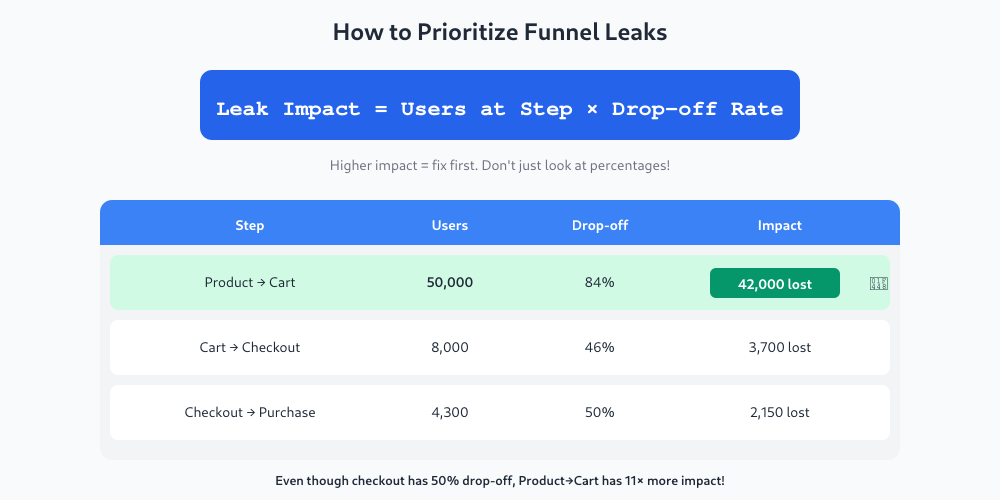
Use this formula to prioritize:
Leak Impact = Users at Step × Drop-off Rate
From the example above:
- Product → Cart: 50,000 × 84% = 42,000 users lost
- Cart → Checkout: 8,000 × 46% = 3,700 users lost
- Checkout → Purchase: 4,300 × 50% = 2,150 users lost
The product-to-cart step is clearly the biggest leak. That’s where to focus first.
I’ve made this mistake myself: obsessing over checkout abandonment when the real problem was three steps earlier. Fix the biggest leak first, then move to the next one.
Step 4: Diagnose Why Users Drop Off
Once you know where the leak is, you need to understand why. Numbers tell you what’s happening; qualitative data tells you why.
Check These Common Causes
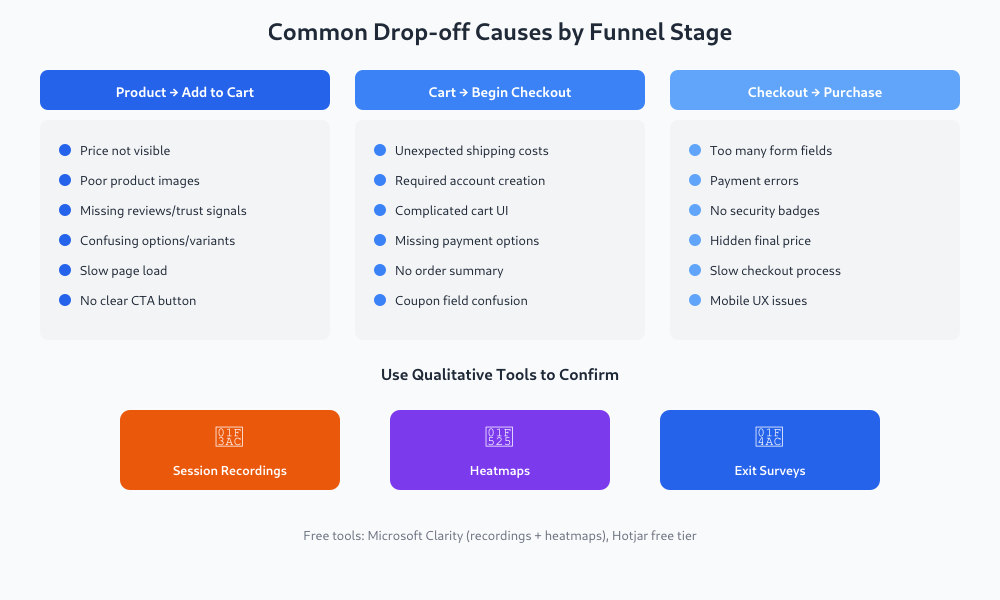
For product page → add to cart:
- Price not visible or surprising
- Poor product images or descriptions
- Missing trust signals (reviews, security badges)
- Confusing variant selection
- Slow page load time
For cart → checkout:
- Unexpected shipping costs
- Required account creation
- Complicated cart interface
- Missing payment options
For a detailed breakdown of each checkout step and what each drop-off point means, see checkout abandonment analysis.
For checkout → purchase:
- Too many form fields
- Payment errors
- Lack of security reassurance
- No order summary visible
If forms are your main conversion point, form analytics can reveal exactly which fields drive people away.
Use Qualitative Tools
Numbers only go so far. To really understand why users leave, use:
- Session recordings — Watch real users interact with the problem page. Tools like Hotjar, FullStory, or Microsoft Clarity (free) show exactly where people hesitate, rage-click, or give up.
- Heatmaps — See where users click and how far they scroll. If your add-to-cart button gets no clicks, maybe it’s not visible enough.
- Exit surveys — A simple “What stopped you from completing your purchase?” popup can reveal issues you’d never guess.
In my experience working with clients, session recordings are worth their weight in gold. Watching five users struggle with the same form field tells you more than a month of staring at charts.
Step 5: Segment Your Data
Overall funnel metrics can hide important patterns. Break down your data by:
- Traffic source — Does paid traffic convert differently than organic? If you’re using UTM parameters, you can compare campaigns directly.
- Device type — Mobile users often have higher drop-off. Is your checkout mobile-friendly?
- New vs returning — First-time visitors behave differently than repeat customers.
- Time period — Did something change recently? Compare this month to last month.
What I’ve seen work best: create separate funnels for mobile and desktop users. Often, a “funnel problem” is actually a “mobile experience problem” in disguise.
Step 6: Fix and Measure
Once you’ve identified a likely cause, fix it and measure the impact. Don’t change everything at once—you won’t know what worked.
Quick Wins to Try First
- Add price earlier in the flow (no surprises)
- Show shipping costs before checkout
- Remove required account creation (offer guest checkout)
- Add trust badges near payment forms
- Reduce form fields to the minimum
- Fix mobile usability issues
Set Up Monitoring
After making changes, monitor your funnel weekly. Set up alerts if conversion rates drop below certain thresholds. According to Gartner research, companies that systematically address funnel drop-offs can increase revenue by 15-30% without additional traffic.
Create a simple dashboard or spreadsheet that tracks:
- Users at each funnel step (weekly)
- Conversion rate between steps
- Week-over-week changes
This doesn’t need to be fancy. A Google Sheet updated every Monday works fine.
A Realistic Example
Let me walk through how this works in practice.
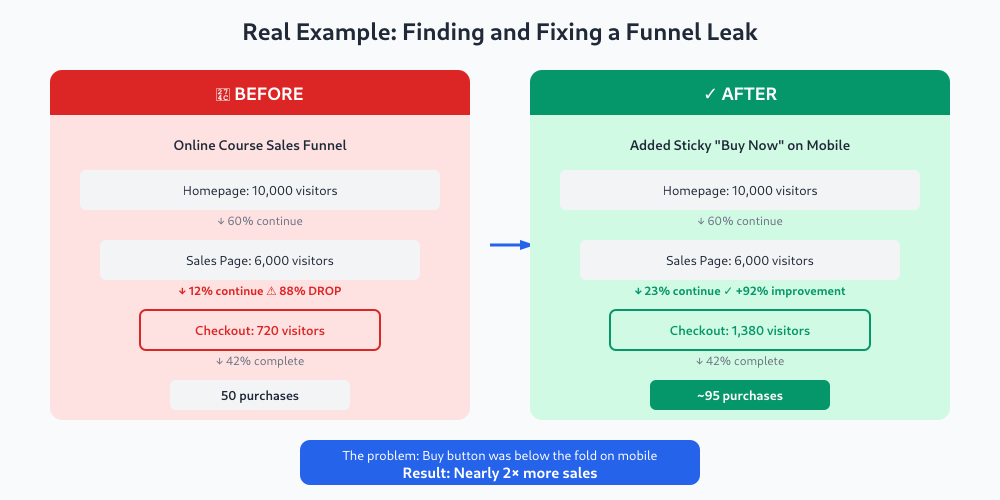
The situation: An online course creator noticed overall sales were down. She had 10,000 monthly visitors but only 50 purchases (0.5% conversion).
Funnel mapping revealed:
- Homepage → Sales page: 60% continued (4,000 lost)
- Sales page → Checkout: 12% continued (5,280 lost)
- Checkout → Purchase: 42% completed (580 lost)
The biggest leak: Sales page to checkout—88% drop-off affecting 6,000 users.
Investigation found: The “Buy Now” button was below the fold on mobile (70% of traffic). Users had to scroll past a 2,000-word sales letter to find it.
The fix: Added a sticky “Buy Now” button visible on mobile throughout the page.
Result: Sales page → checkout improved from 12% to 23%. Monthly purchases nearly doubled.
Start With One Funnel
You don’t need to analyze every possible path through your site. Start with your primary conversion funnel—the one that drives the most revenue or signups.
- Map the steps
- Get baseline numbers for 90 days
- Find the biggest leak (volume × drop-off rate)
- Investigate why users drop off there
- Fix the most likely cause
- Measure the impact
- Move to the next leak
Pretty quickly you’ll develop an intuition for where problems hide. And each leak you fix compounds—improving step 2 means more users reach step 3, which means your step 3 improvements matter even more.
That’s the power of systematic funnel analysis. You stop guessing and start fixing what actually moves the needle.
Keep reading: what session replay shows (and what it misses).
Jonathan Harrington
I write practical, no-preamble guides on web analytics, privacy-friendly tracking and data-driven marketing — start with the problem, then pick the data.
More about me →