How to Compare Attribution Models Without Losing Your Mind

You switched from last-click to data-driven attribution and suddenly Facebook looks three times more valuable than it did yesterday. Your paid search numbers dropped. Your boss wants to know which report is “right.” The honest answer: neither — and both. Every attribution model tells a different story about the same customer journeys. The trick isn’t finding the correct one. It’s learning to read the disagreements.
In this guide, I’ll walk you through a practical method for comparing attribution models side by side — and show you how those differences actually reveal useful things about your channels. No spreadsheet acrobatics required.
Why Different Models Give Different Answers
Before we get into the how, let’s clear up a common frustration. Different attribution models aren’t broken. They’re designed to disagree.
Each model answers a slightly different question:
- Last-click: Which channel closed the deal?
- First-click: Which channel started the journey?
- Linear: Which channels participated equally?
- Position-based (U-shaped): Which channels introduced and closed, with some credit for the middle?
- Data-driven: Based on all our conversion paths, which channels seem to matter most statistically?
Think of it like asking five witnesses to describe the same car accident. They each saw it from a different angle. None of them are lying — they just noticed different things.
The problem comes when teams switch models mid-quarter and suddenly their performance numbers shift dramatically. Nothing changed in reality. The lens changed. If you understand how attribution works at a fundamental level, this starts making a lot more sense.
The Comparison Method: Stop Debating, Start Comparing
Here’s the approach I’ve seen work best with clients. Instead of arguing about which model is correct, run the same time period through two or three models and look at where they disagree. That’s where the real insights are.
Pick Your Time Window
Choose a 30-day period with reasonably stable spending. Avoid launch weeks, major promotions, or anything that would skew the data. You want a “normal” month.
Export Channel-Level Data Under Each Model
In Google Analytics 4, you can switch attribution models in the attribution settings (Admin > Attribution Settings). For comparison purposes, use the Model Comparison report under Advertising. You can view the same data under different models side by side.
If you’re using other platforms, export a CSV of conversions by channel for each model you want to compare.
Build a Simple Comparison Table
Put the data into a table like this — one row per channel, one column per model:
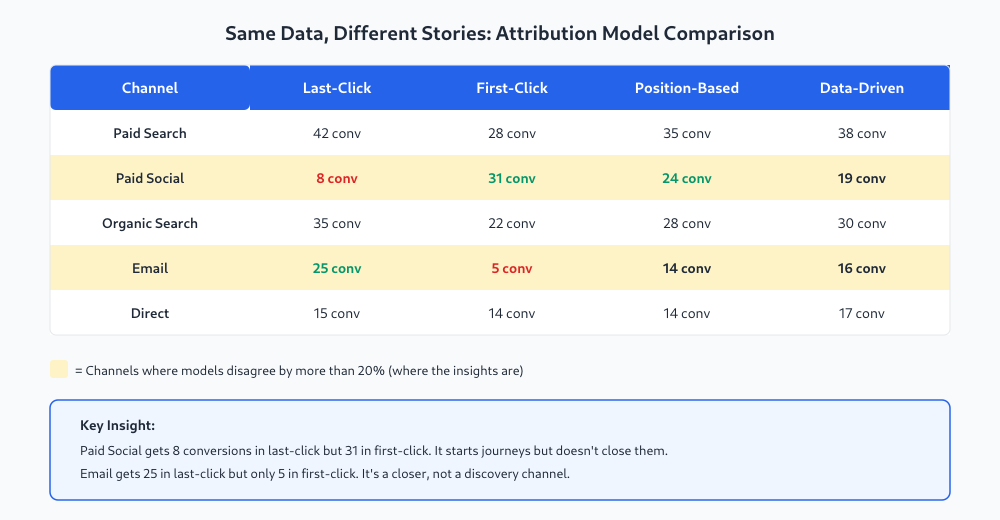
Highlight Disagreements Over 20%
This is the key step. For each channel, look at the spread between its highest and lowest conversion count across models. If the difference is more than 20%, highlight that row. Those are the channels where the model choice actually changes the story.
In the example above, paid social and email jump out immediately. Paid search and direct are relatively stable across models — the model choice doesn’t change their story much. But paid social and email look completely different depending on which lens you use.
What the Disagreements Actually Tell You
This is where it gets useful. The pattern of disagreement reveals what role each channel plays in your customer journey.
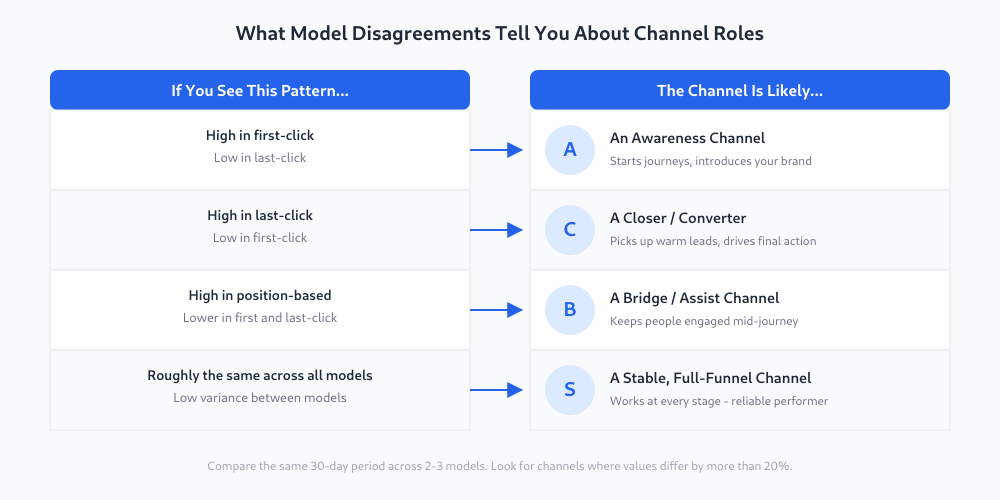
Let me walk through the most common patterns:
High first-click, low last-click = awareness channel. Paid social is the classic example. It introduces people to your brand, but they don’t convert on that first visit. They come back later through search or email and convert there. If you only look at last-click, you’ll massively undervalue these channels. You might cut their budget and then wonder why your pipeline dried up six weeks later.
High last-click, low first-click = closer channel. Email and retargeting typically show this pattern. They pick up warm leads who already know you and push them over the finish line. These channels look like heroes in last-click, but they rarely start journeys. Understanding the difference between primary and secondary conversions helps here too — closers often drive the final primary conversion after other channels generated the initial interest.
Stable across all models = full-funnel channel. Some channels, like branded paid search, show roughly the same numbers no matter what model you use. These are reliable performers that work at every stage. They’re the least interesting from an attribution perspective — but the most trustworthy from a budget perspective.
A Real-World Example
I worked with an e-commerce client who was running Facebook ads, Google Search, email campaigns, and some display retargeting. Under last-click, Facebook looked like a waste — 6% of conversions for 25% of the budget. The CEO wanted to cut it.
We ran the comparison. Under first-click, Facebook was responsible for introducing 34% of all converting users. Under position-based, it sat at around 22%. The data-driven model in GA4 gave it 18%.
None of those numbers are “the truth.” But together they told a clear story: Facebook was an awareness engine. It wasn’t closing deals, but it was filling the top of the funnel. The channels that looked great under last-click — email and branded search — were converting people that Facebook had introduced weeks earlier.
We didn’t change the attribution model. We changed how we evaluated Facebook. Instead of holding it to a last-click CPA target, we gave it a cost-per-new-visitor target. That was the metric that actually matched its role. To understand whether the overall approach is working, you still need to evaluate whether your ads are actually driving results.

The Incrementality Question
Here’s the thing most guides won’t tell you: attribution models, no matter how sophisticated, are all based on correlation. They can tell you which channels touched a customer before conversion. They can’t tell you whether the customer would have converted anyway.
The only real test of a channel’s value is incrementality testing — turning the channel off in a specific market or segment and measuring what happens. Did conversions actually drop? By how much?
This is the gold standard, and almost nobody does it. Here’s why:
- It requires enough volume to run a statistically valid test
- You need a control group (geographic or audience-based holdout)
- It takes 4-8 weeks to get meaningful results
- Turning off a channel means losing revenue during the test period
- Most stakeholders won’t agree to “just turn off Facebook for a month and see what happens”
If you can run incrementality tests, they’ll teach you more than any attribution model comparison. But for most teams, the comparison method I described above is the practical alternative. It won’t give you causal proof, but it gives you a much richer picture than staring at a single model.
The Practical Decision Framework
After years of watching teams go back and forth on attribution, here’s the framework I recommend:
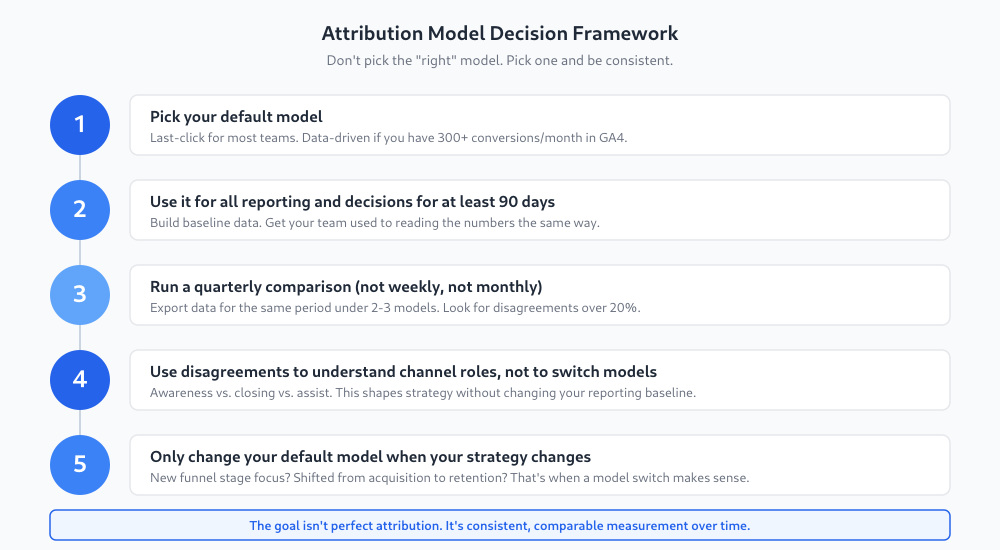
Pick one default model. For most teams, last-click is fine. If you have more than 300 conversions per month in GA4, data-driven is worth using. Don’t overthink this.
Use it consistently for at least 90 days. Build your baselines. Get your team comfortable reading the numbers. The worst thing you can do is switch models every quarter — you lose all ability to compare performance over time.
Run a quarterly comparison. Once a quarter, pull the same 30-day period through two or three models. Look for the disagreements. Use them to understand your channel roles, not to change your reporting model.
Only switch models when your strategy changes. Shifting from acquisition to retention? Moving upmarket? Launching a new product line? Those are legitimate reasons to reconsider your default model. “This model makes my numbers look better” is not.
Document your choice. Write down which model you’re using, when you started using it, and why. Future you (or your replacement) will thank you.
Common Mistakes to Avoid
Switching models to justify a budget decision you’ve already made. If you change your attribution model to make a channel look better right before a budget review, everyone will notice. It undermines trust in all your data.
Comparing numbers across different model periods. “Last quarter we had 200 conversions from paid search, this quarter we have 150” means nothing if you also switched from last-click to data-driven between those quarters. Apples to oranges.
Treating data-driven as “the answer.” Data-driven attribution is more sophisticated than last-click, but it’s still a model. It has its own biases. It needs volume to work well. And it’s a black box — you can’t easily explain why it assigned credit the way it did.
Ignoring assisted conversions entirely. Even if you use last-click as your default, check the assisted conversions report regularly. It shows you which channels participate in journeys without getting credit, which is essentially a free sanity check on your model.
Which attribution model is the most accurate?
How often should I compare attribution models?
Should I switch to data-driven attribution in GA4?
What is incrementality testing and do I need it?
Jonathan Harrington
I write practical, no-preamble guides on web analytics, privacy-friendly tracking and data-driven marketing — start with the problem, then pick the data.
More about me →